

By William M. Rodgers III | Federal Reserve Bank of St. Louis
For decades, researchers have performed quantitative studies that describe and explain the white-Black wage gap.1 Three questions are among those that dominate this voluminous body of research:
- How much does widespread economic growth lead to a narrowing of the wage gap?
- How much of the white-Black wage gap can be attributed to racial differences in education and work experience?
- What happens to the white-Black wage gap when those who report zero annual wages and salary are included in the analysis?
This blog post examines these questions using data from the Census Bureau Current Population Survey’s March Annual Social and Economic (ASEC) Supplement from various years. One benefit to using these data is that the annual measures of income from wages and salary, weeks worked, hours worked, race, age and educational attainment extend back to 1962. (Measures for race, age and educational attainment are for the March of the supplement calendar year. The wages and salary, weeks worked and hours worked are for the previous calendar year.)
Is Strong Economic Growth Synonymous with Smaller Racial Wage Gaps?
How much does widespread economic growth narrow the white-Black wage and salary gap? This is an important question, as research has shown that during times of economic prosperity, Black people benefit disproportionately. (See, for example, “Area Economic Conditions and the Labor Market Outcomes of Young Men in the 1990s Expansion,” which is Chapter 2 in the book Prosperity for All? The Economic Boom and African Americans.)
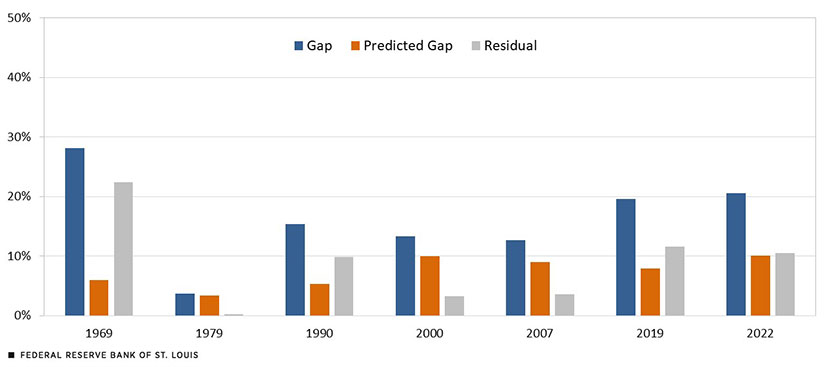
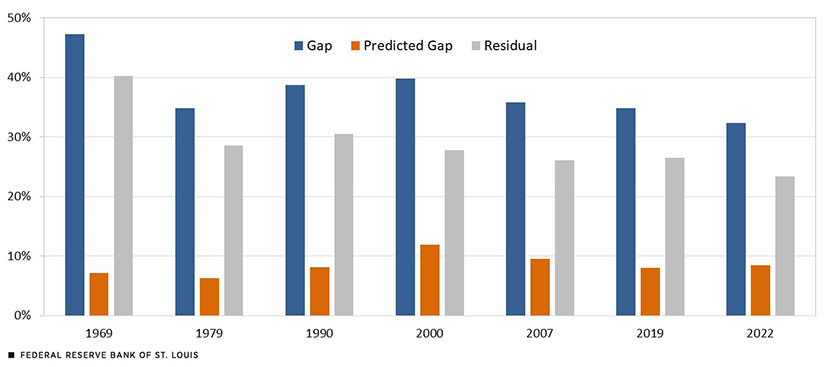
The first set of figures below shows white-Black annual wage and salary gaps by gender for adults ages 25 to 64. The estimates labeled “Gap” correspond to the difference in the average annual wages of white and Black workers who worked full time and full year. The annual wages and salary are for the calendar years. Note 1969, 1979, 1990, 2000, 2007 and 2019 correspond to peaks in the business cycle, meaning that if the economy was to have its strongest ability to narrow the gap, it would occur during these years. 2022 is the most recent data available.
As the first of the two figures shows, the wage gap between adult white and Black women (those age 25 to 64) narrowed to about 13% in 2007. However, after that, the gap expanded to about 21%. It stabilized during the COVID‑19 pandemic. The wage gap among adult men fell from 1969 to 1979, as the second figure shows, but after that remained between 30% and 40%.
White-Black Wage Gaps Grew or Stabilized after Declining
Adult White Women and Black Women
 Adult White Men and Black Men
SOURCES FOR BOTH CHARTS: Author’s calculations for the calendar years’ microdata from the ASEC Current Population Survey.
NOTES FOR BOTH CHARTS: Workers are full-time and full-year and ages 25 to 64. Earnings “Gap” refers to the difference in average wages between Black and white workers during the previous calendar year. “Predicted Gap” refers to the predicted racial wage gap attributable to racial differences in education and age, a proxy for experience. “Residual” refers to the unexplained portion of the wage gap.
The Contribution of Education and Age to the White-Black Wage Gap
Previous research has shown that racial differences in education explain a significant portion of the racial wage gap. The previous figures show, along with the wage gap, the “predicted” white-Black wage gap attributable to racial differences in education and age. That is, the predicted gap represents the wage difference that would exist solely due to racial differences in education and age. The figures indicate that these differences explain about one-half of the wage gap among adult white and Black women in 2022, and 26% among adult men, for instance.
To summarize, racial differences in educational attainment and age explain a relatively small fraction of the white-Black earnings gap, in general. Does this mean that all the “residual” (unexplained) gaps reflect the role of labor market discrimination? No. When examining wage gaps, economists also take into account additional personal characteristics, employer behavior and institutional measures. Research suggests that the following factors play roles: cognitive skills, networks, health status, firm size, union membership and measures of general inequality.2
Impact of Including Those Who Reported Zero Annual Wages and Salary
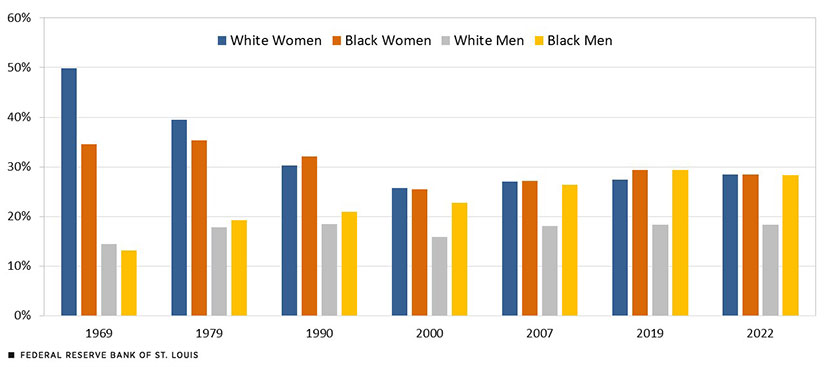
What happens to the white-Black wage gap when the share of Black men and women who report their annual wages and salary as zero is included in the analysis? Adding their zero values accounts for racial differences in unemployment and labor force participation. It is well known that the jobless rate of Black people historically has been about twice the white unemployment rate, and that Black men have lower labor force participation than white men.
The figure below shows for each demographic group the share of individuals in the 25- to 64-year-old age group who reported zero income from wages and salary. The numbers show that, across the years, smaller shares of adult white men tended to report having zero wage and salary income. The shares for adult white women have fallen since 1969, stabilizing at less than 30%. From 1969 to 2019, the share of Black men with zero income rose but in 2022 remained close to 30%.
Respondents Reporting Zero Annual Income in Wages and Salary
SOURCES: Author’s calculations from the calendar years’ microdata from the ASEC Current Population Survey.
NOTE: Workers are ages 25 to 64.
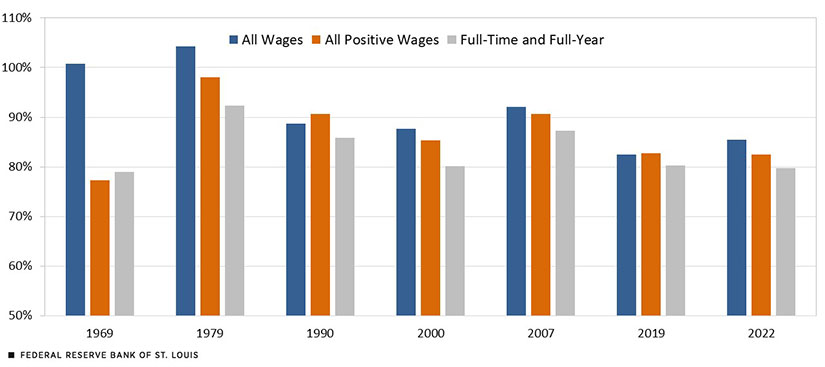
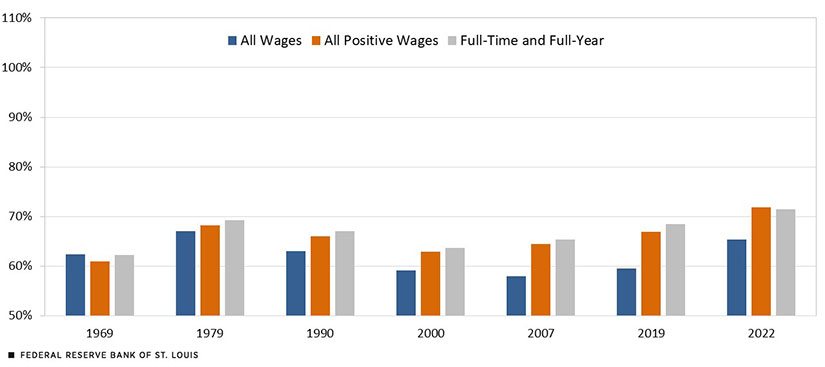
The figures below show what happens to the wage ratio when the shares with zero wages and salary are included. For adult women, the ratio of Black to white income from wages and salary gets larger as one moves from the full-time and full-year estimates to the estimates that include the zero wage income shares (reflected in “All Wages”).
Including Zero Wages and Salary Affects Income Gaps in Different Ways
Ratio for Black Women and White Women
 Ratio for Black Men and White Men
SOURCES FOR BOTH CHARTS: Author’s calculations from the calendar years’ microdata from the ASEC Current Population Survey.
NOTES FOR BOTH CHARTS: Workers are ages 25 to 64. Estimates are the ratio of Black and white income from wages and salary.
The ratios among adult men get smaller when we move from full-time and full-year estimates to those that include the zero wage income shares. Including those with zero income lowers the income of Black men relative to white men. The ratio in 1969 is an exception.
The inclusion of those with zero income from wages and salary also has a major impact on the estimates of wage gaps. In 2022, the wage and salary ratio for adult Black women was lower than it was in 1969. The 2022 ratio for adult Black men was higher than measured in 1969, but still indicated a lack of wage and salary parity.
Conclusions to Date
This blog post shows that even in the tight labor market period that started March 2022, sustained low unemployment has had a limited effect on the white-Black wage gap, especially the gap that includes racial differences in reporting zero income from wages and salary. Racial differences in educational attainment and work experience explain a small portion of today’s wage gap. In the Institute for Economic Equity’s upcoming State of Economic Equity report, I will examine the white-Black wage gap for young workers, those age 18 to 24.
I also plan to extend my analysis of the white-Black wage gap when the March 2024 ASEC Current Population Survey data for the 2023 full calendar year are available. The reported income will correspond to the “tightest” labor market on record—the lengthy period during which the national jobless rate has been at or below 4% for a sustained period. The data will help us identify the extent to which strong economic activity has been able to reconnect young Black men and women to employment and wages.
The History of the U.S. White-Black Wage Gap from 1969 to Now added by NewBlackVoices on
View all posts by NewBlackVoices →